Abstract
Over the weekend, rather than working on the blog post topic I originally had in mind, I spent some time trying to figure out how to benchmark and optimize my website. Because of that, I thought I might do a small write-up for anyone that is interested and does not already know a better way to do this. I also want to stress, I am by no means a web dev nor do I have in-depth knowledge of web site or web server optimization; these are simply things I found that seemed helpful and improved my “score” on the benchmarks.
Benchmarking Performance
It is always good practice to do benchmarks before making adjustments to anything. Without the baseline, it is difficult to know what has improved if anything. So, we are going to take a preliminary benchmark using bombardier and PageSpeed Insights. My starting point is having HTTP/2 and HTTP/3 setup on my nginx web server running on a FreeBSD 14.2 host. The nginx config is largely default except what has to be changed for my sites, and obviously for enabling HTTP/2 and HTTP/3. If you want to know how to do that, this post will walk you through the process.
Let’s start with the benchmark from bombardier:
bombadier -d 30s -c 50 -l https://example.comThis command will run for 30 seconds with 50 connections testing the
site example.com (please don’t run this on sites you don’t have
permission for). The -l flag will show latency statistics
for the connections. The output will look something like:
bombadier -d 30s -c 50 -l https://foxide.xyz
Bombarding https://foxide.xyz for 30s using 50 connection(s)
Done!
Statistics        Avg      Stdev        Max
  Reqs/sec       775.56     510.93    2466.41
  Latency       64.39ms    16.08ms   581.82ms
  Latency Distribution
     50%    63.07ms
     75%    66.13ms
     90%    68.88ms
     95%    71.91ms
     99%    81.14ms
  HTTP codes:
    1xx - 0, 2xx - 23317, 3xx - 0, 4xx - 0, 5xx - 0
    others - 0
  Throughput:     1.51MB/s
The above statistics show information on requests per second, latency, as well as the HTTP codes that were received on the requests. From the graph above, we can see my site was able to process ~775 requests per second on average with ~2466 being the peak requests per second. For the purposes of this bench mark, we want this number to be as big as possible (with only receiving 2xx HTTP codes) meaning we were able to process more traffic. Next, we see the latency statistics with the average being ~64.39 milliseconds and the max being ~581.82 milliseconds; unlike the requests per second, this number should be as low as possible.
In addition to that command-line tool, Firefox as well as Chromium have some builtin web development tools that show performance metrics among other things. This post is going to use Firefox as it is my preferred browser, however, much of the information should translate decently well to Chromium based browsers. To open the web tools in Firefox, click on the three lines in the toolbar on the right -> More tools -> Web Developer Tools, alternatively CTRL+SHift+I can be pressed to open the same tools. On the menu that pops up, click “Network” and reload the page.
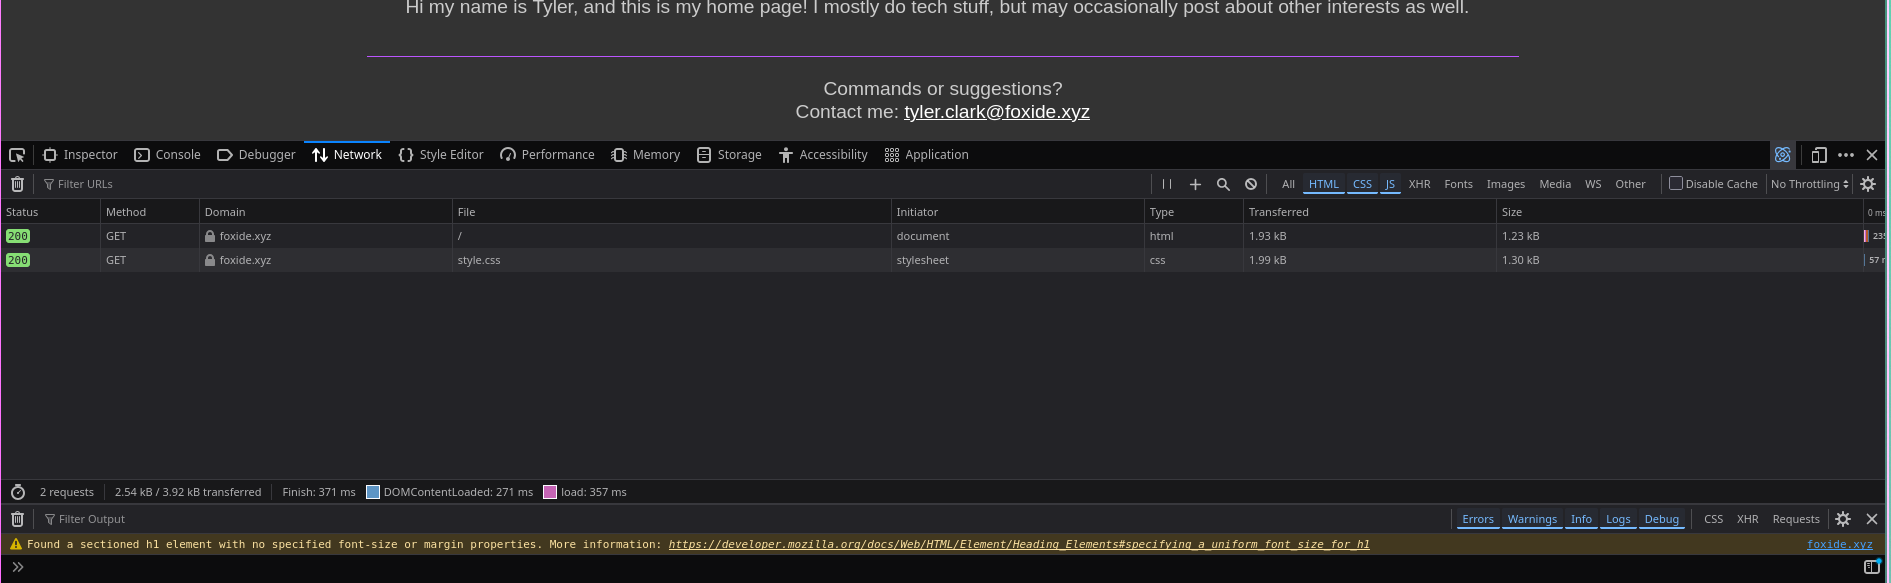
This will show each of the files that are loaded with the web page. As you see in this example, my site only loads the html page and the stylesheet. Clicking on the file then on the “Timings” tab that shows up will show a basic flame graph for the file on the page. For the most accurate results, make sure to disable caching.
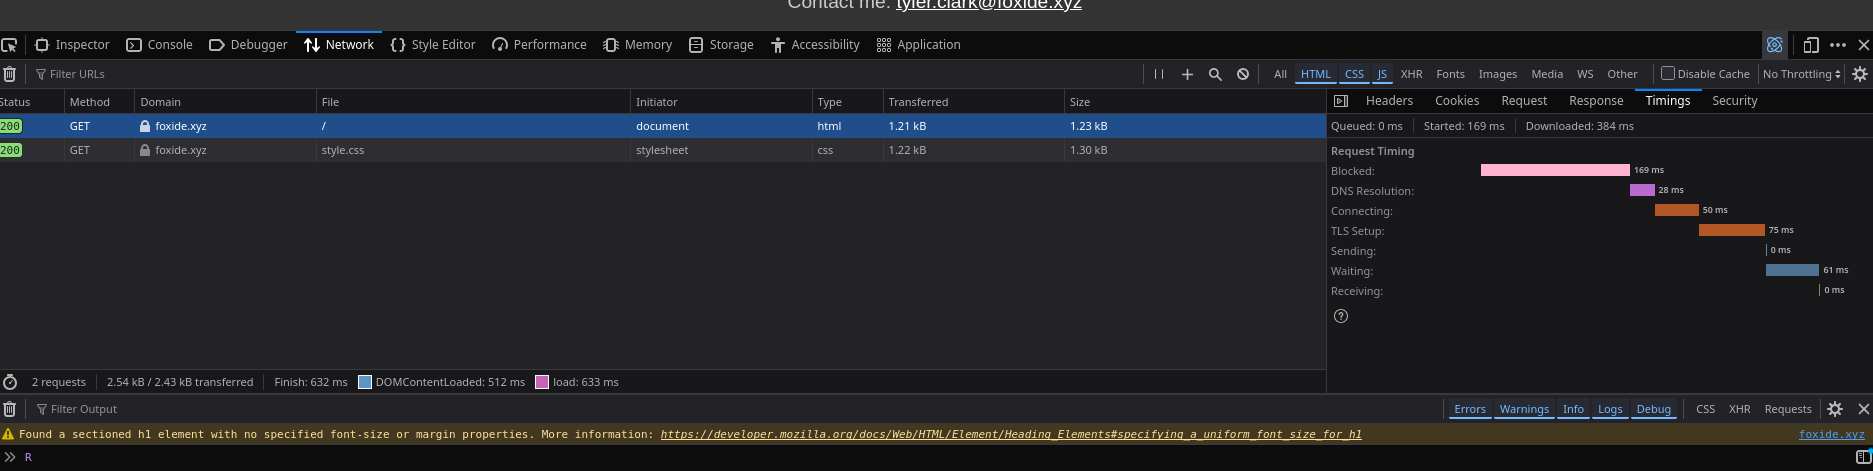
As you can see it took around 57 milliseconds for the page to load without throttling; however, this is an ideal circumstance. We should also test load times with throttling to check and see how the site performs under different circumstances, bonus points if we test different mobile device profiles. To check how our site performs on a worse network connection, simply click the throttle button and select the level of throttling desired. I am not going to delve too deeply into the throttling because while it is good to use for testing, it is a fairly straight forward concept and does not really change anything for a guide. The only real thing worth noting is that it will point out inefficiencies much better. So, if you are having trouble finding the inefficiencies, try throttling the loading down really hard to make it more obvious.
The last benchmarking tool that I am going to use is PageSpeed Insights, which is a tool made by Google. Normally, I wouldn’t recommend Google-made tools, however, if your site is being made public than Google will find it eventually. They are also industry leaders in the web field, so their tools are probably at least halfway decent for the job, so I am going to use it for this post. If you do not want to use it because of its author, that is reasonable and skipping this section is appropriate. Using the tool is fairly simple, just put the URL of the site in and wait for the results. The results have two variations, one for mobile and one for desktop with the desktop generally yielding better performance (in my experience). Here are the my results for Foxide.xyz:
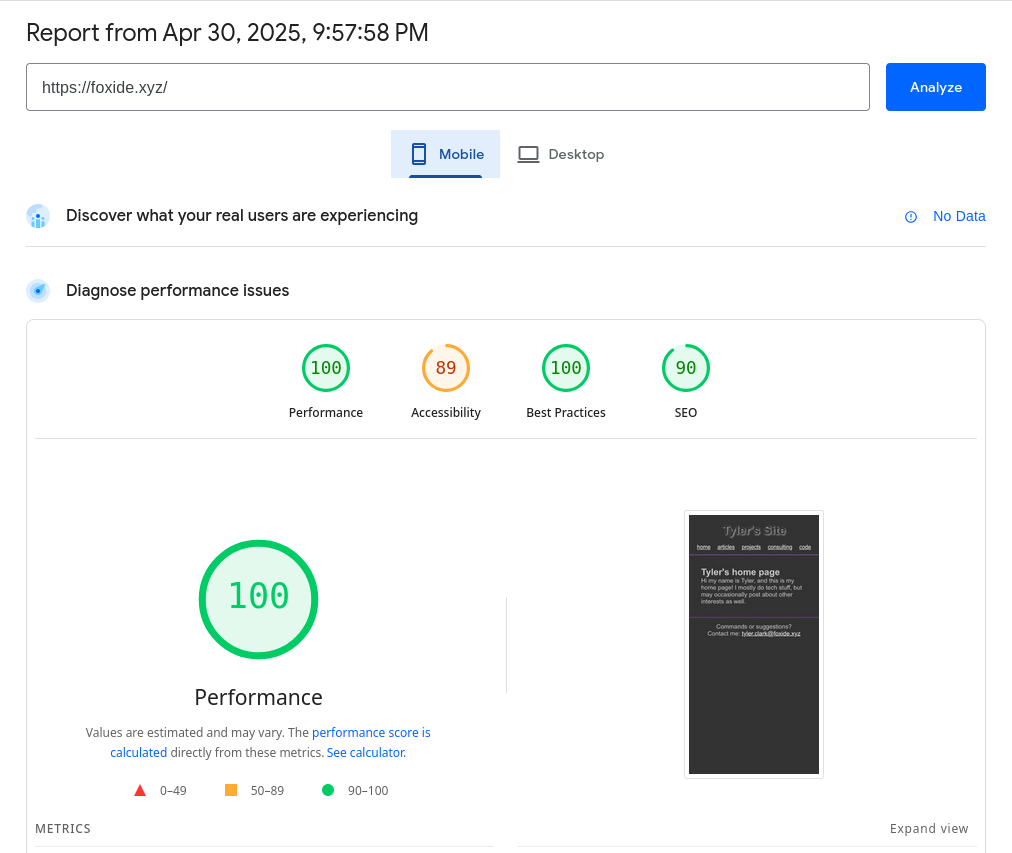
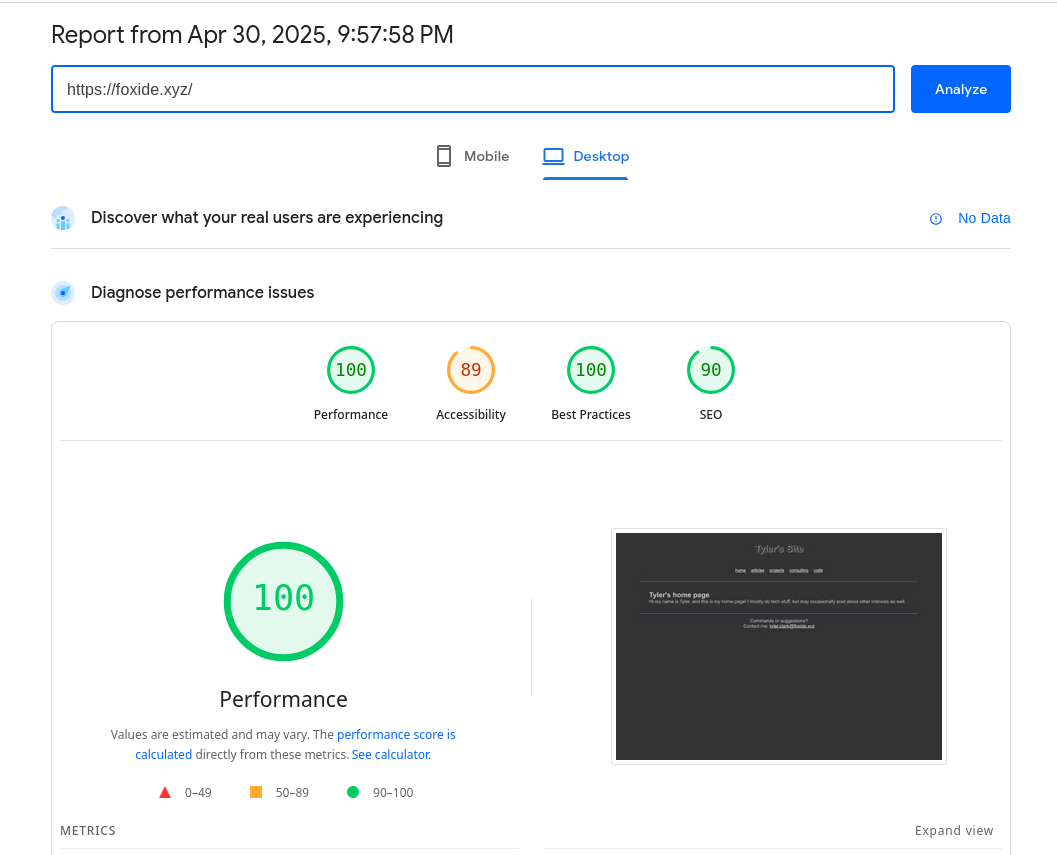
The main performance results that we are concerned about (at least for the purposes of this post) are the “Performance” results, and the “Best Practices” results (because best practices are always important). Since my site is a fairly basic static site, it scores well just because it doesn’t have much to load. Scrolling down will also give metrics and diagnostics for what might be causing the site to load at the speed it is, as well as giving recommendations for fixing it and making it perform better.
Optimizing Delivery
Now that we have the current stats for our site, we can start making tweaks to boost the performance. It is worth pointing out that the type of content being served on the server will impact the specifics of how to optimize performance. The process for increasing performance on an instance of Wordpress is going to be quite a bit different than optimizing a static site, additionally it is going to be much easier to make a static site load quickly than something like Wordpress. So, before working too much on the Nginx optimizations, try to optimize the application itself as much as possible. Once that is done, then come back and work on improving how Nginx will serve the page.
The process for implementing any sort of performance improvement is to implement one setting at a time and re-test to see if it has the impact that you expected. The biggest reason for this, is if you implement 100 changes and the performance is worse, it is really difficult to tell which setting(s) are causing the degradation. It is also worth noting that performance tests can yield different results between runs, even without changing anything. So before making heavy modifications (especially ones that you do not understand well) run the benchmarks and get an average of what is expected, then start changing stuff (after also taking a backup of the original configs) and run them again.
After backing up the original Nginx config and noting down the average performance benchmarks, we are finally ready to attempt to improve performance. For this, I am going to write a pseudo nginx config with options that can help performance, as well as some comments that help explain what the line does, and some options for how it is configured and why I have chosen the value I did. Keep in mind, that every workload is going to vary slightly, so while the options I have here might work for me, they should be tested and tweaked to your workload.
# The optimal value for the worker_processes option varies depending on a few different things
# The main one that most people will reference is CPU cores, but there are other things that
# can affect the optimal value such as hard disks. For most people, setting this option to
# 'auto' will suffice as nginx will attempt to detect a "best" value on its own.
worker_processes auto;
# This option reduces the amount of information that the nginx error log stores
# Reducing the information stored increases performance by reducing the amount
# of writes to the disk. This does also decrease visibility into issues though,
# so be mindful of what your concerns are before changing this option this way.
error_log /var/log/nginx/error.log crit;

events {
# The worker connections define how many simultaneous connections can be opened by a worker process.
# This number includes all connections such as connections to proxy servers as well as other connections.
    worker_connections 4096;
# This configuration item is the connection processing method.
# Because the host I am running on is FreeBSD based, kqueue is the more efficient option,
# however, for Linux it would be epoll. For more information on this option
# please read the docs located here - https://nginx.org/en/docs/events.html
    use kqueue;
}

http {
    include mime.types;
    default_type application/octet-stream;

    # File caching that will keep the most common files
    # readily available. It can increase performance
    # but will likely need tuning
    open_file_cache max=200000 inactive=20s;
        open_file_cache_valid 30s;
        open_file_cache_min_uses 2;
        on;

    # Turning access logs off decreases disk writes, boosting performance
    access_logs off;

    # Sendfile is faster than read() and write()
    sendfile on;

    # Send headers all at once
    tcp_nopush on;

    # Enables unbuffered proxying on TLS connections
    tcp_nodelay on;

    # Enabling gzip to compress the amount of data being sent to remote clients
    # as well as various config options surrounding gzip. More info
    # https://nginx.org/en/docs/http/ngx_http_gzip_module.html
    gzip on;
    gzip_min_length 10240;
    gzip_comp_level 2;
    gzip_disabled msie6;
    gzip_proxied pired no-cache no-store private auth;
        gzip_types
    text/css
    text/javascript
    text/plain
    text/xml;

    # Sets buffer size for client request bodies.
    # In the event that the request body is larger
    # than the buffer, it is written to a temp file
    # that temp which is two memory pages by default.
    # On 32-bit machines it would be 8K and 64-bit machines
    # it would be 16K
    client_body_buffer_size 16k;
    # This sets the size for the client request header
    # 1K is generally enough here
    client_header_buffer_size 1k;
    # Sets max client body before giving error
    # It is worth noting that most browsers
    # cannot appropriately communicate this error
    client_max_body_size 8m;
    # Sets the max number and size of buffers for reading
    # large client request headers
    large_client_header_buffers 2 1k;
}

server {
    .
    .
    .
    # This can be added to an existing server block
    # so imagine this section is configured with a site

    # This configures client side caching for some file types:
    location /*.(jpg|jpeg|png|gif|ico|css)$ {
        expires 365d;
    }
}
Results?
Enabling the above configuration options, or options similar, provided some slight performance improvement to my static site. However, I also modified these options for my CryptPad instance; it now loads noticeably faster. I would estimate around 15% or better loading speeds thanks to these optimizations. Running PageSpeed Insights against my CryptPad instance previously got a score in the mid 50s on the performance metric, but after enabling the stated options, I am getting between 65 and 75 in the performance score on mobile and a 96 on Desktop. Using CryptPad on my phone also feels noticeably faster and more snappy when interacting with it. Again, as stated in a previous paragraph, these options are not something that is going to work the same for everyone, but you can modify them to fit your use case and significantly boost the responsiveness of your webpage(s).